No reports of injuries or major damage were called in to police or fire agencies. The San Jose Earthquake is just another bad incident for the citizens of California who have been battling wildfires for the last few weeks.
Wednesday, October 31, 2007
5.6 quake in San Jose rattles Bay Area
Friday, October 26, 2007
FEMA Press Conference A Joke
 (from Washington Post) FEMA has truly learned the lessons of Katrina. Even its handling of the media has improved dramatically. For example, as the California wildfires raged Tuesday, Vice Adm. Harvey E. Johnson, the deputy administrator, had a 1 p.m. news briefing.
For the FEMA Press Conference, reporters were given only 15 minutes' notice of the briefing, making it unlikely many could show up at FEMA's Southwest D.C. offices.
They were given an 800 number to call in, though it was a "listen only" line, the notice said -- no questions. Parts of the briefing were carried live on Fox News (see the Fox News video of the news conference carried on the Think Progress Web site), MSNBC and other outlets.
Johnson stood behind a lectern and began with an overview before saying he would take a few questions. The first questions were about the "commodities" being shipped to Southern California and how officials are dealing with people who refuse to evacuate. He responded eloquently.
More: FEMA Meets the Press, Which Happens to Be . . . FEMA>Tuesday, October 23, 2007
Southern California fire map and San Diego County fire map
SunEdison Recieves U.S. Department Of Energy's 2007 Green Power Leadership Award
Southern California Wildfires Burn Out of Control: New NASA Satellite Images Show Fires' Rapid Growth
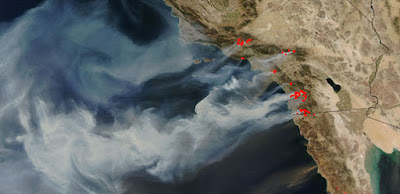 NASA satellites continue to capture remarkable new images of the wildfires raging in Southern California. At least 14 massive fires are reported to have scorched about 425 square miles from north of Los Angeles to southeast of San Diego.
These latest images, captured by NASA satellites on the afternoon of October 22, show the thick, billowing smoke coming off the numerous large fires and spreading over the Pacific Ocean. Fire activity is outlined in red.
Dry, drought-stricken vegetation and Santa Ana winds, which can reach hurricane speeds, have contributed to the devastating effect of these blazes. The National Interagency Fire Center reports that the Santa Ana winds are expected to continue through Wednesday.
According to news reports, almost 700 homes have been destroyed and hundreds of thousands of residents have been forced to evacuate.
Today, President Bush issued an emergency declaration for seven California counties, ordering federal disaster relief to the area.
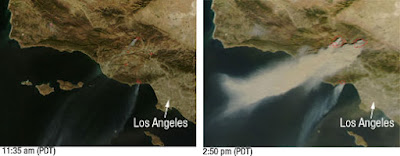
Powerful Santa Ana winds have fueled more than 10 large wildfires throughout Southern California, stretching from Santa Barbara to San Diego.
This pair of images, depicting the area around Los Angeles on October 21, 2007, shows just how quickly the fires grew.
The left image, captured by NASA’s Terra satellite at 11:35 a.m. local time, shows several fires giving off small plumes of smoke. Just over 3 hours later, at 2:50 p.m. when NASA’s Aqua satellite passed overhead, large amounts of smoke were pouring from blazes northwest of Los Angeles. Actively burning fires are outlined in red.
In the right image plumes of smoke can be seen blowing off the coast, indicating the intensity of the winds and the presence of additional fires farther south.
According to the National Interagency Fire Center, these blazes have burned over 84,000 acres since they began over the weekend. Thousands of residents have been evacuated from their homes and a state of emergency has been issued for 7 California counties.
More>Google Maps Mashup: San Diego County Fires

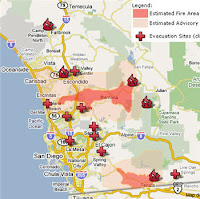
The California wildfires are burning out of control with up to 250,000 citizens from San Diego County facing evacuations (See California Wildfires- San Diego Evacuation Areas). Major wildfires are burning throughout
San Diego County and the county is using Reverse 911 (What is Reverse 911) to help contact people and organize evacuations (See Reverse 911 : San Diego Fires and Mobile Messaging) . This map will update as information comes in. Key map points indicate San Diego evacuation points, closed roads, and actual fire/hazard areas.
Reverse 911 : San Diego Fires and Mobile Messaging
The disastrous fires burning in San Diego have initiated a service used by the city and county government to inform and update residents. Mandatory evacuation orders have been communicated via reverse 911 on both landline phones and mobile phones. The messages are prerecorded and as I’ve said, three messages have been received on my phone. The first was an evacuation order.
The next message was a notice that San Diego schools are closed until further notice along with the instruction to keep children inside and restrict their activity levels (smoke and ash is so thick in the air that keeping it out of your house is impossible during large fires). The third message was information on evacuation centers that were still open as several are already full.
Wednesday, October 17, 2007
GIS Mapping To Trace Jumbos
 BHUBANESWAR: After its role in managing natural resources, disaster management and more recently of malaria in the State, geo-information system (GIS) applications have come as a great help in another key area of wildlife management, i.e. reducing man-animal conflicts.
As per a study by Chandaka Dampara Sanctuary authorities, the movement pattern of specific elephants, its flagship species, can now be known through proper GIS mapping over the years with the help of annual and seasonal data interpretation so that the elephant depredation can be predicted and managed properly with the help of the villagers of the periphery areas.
Though it is still at a preliminary stage, the month-wise flow of elephant movements out of the sanctuary in co-ordination with different parametres like cropping pattern and water availability inside the sanctuary and their co-relations can be found out from the GIS study, says DFO Akshaya Kumar Pattnaik.
Explaining one such parameter like the least disturbing time of the sanctuary, ie. rainy season and the most disturbed period, ie. winter or post-harvesting season, according to elephant point of view, he says that the disturbances created by biotic pressure (human beings) after the harvesting season causes another major concern.
Inhabitants of the periphery villages go to forest for firewood collection, non-timber forest products and use the area for grazing their cattle and these activities after January are incorporated in the GIS mapping process.
World Worst Polluted Places 2007

It’s definitely not one of the ‘Top Ten’ lists you’re likely to be campaigning for. The Blacksmith Institute, an NGO that works to solve pollution problems in the developing world, has released its second annual list of the World’s Most Polluted Places. This year’s list includes two sites each in China, India and Russia, and one site in Azerbaijan, Peru, Zambia and Ukraine. This threat is affecting more than 12 million people, according to the research done by Blacksmith with Green Cross in Switzerland. Those 12 million people mentioned are well open to respiratory diseases such as asthma, as well as birth defects and premature death.
Many of the sites’ pollution comes from mining of heavy metals like lead and chromium; all of the sites pose serious threats to human health and the environment.
Stephen Colbert decides to run for President
Tuesday, October 16, 2007
Maps of War
Friday, October 12, 2007
Wednesday, October 10, 2007
GIS : Enhancing security on energy transport systems
 Besides measures encouraging investments in energy transport infrastructures to develop competition and to assure security of supply, European and national institutions are seeking to frame the risks related to the use of those equipments, in particular risks linked to gas and hydrocarbons pipeline transport.
To this end, an exhaustive inventory and a precise positioning of pipeline equipment, associated to a description of their close environment, seem to be fatal factors for security.
Since summer 2006, a legal constraint generalizes Geographical Information Systems (GIS). Indeed, main gas, chemical products and liquid or liquefied hydrocarbons transporters, exploiting pipelines in France, are forced to implement GIS before 2009 in accordance with professional and recognized guidelines. Those GIS are a new generation of information systems combining cartographic representations and data information (transport infrastructures, sections of network, new buildings…). The equipments are thus known as “geo-referred”.
GIS? Show Me the Money!

From: The American Surveyor
There is a lot of talk about the role that GIS plays in business, and in society at large. I'd like to talk about what GIS means to surveyors, at least to this surveyor: my experience with GIS technology, and the way it has performed for me, convinces me that it is an excellent tool for any surveyor to have in his toolbox. Not only does it make a lot of sense for our spatially-oriented projects to use a consistent geo-centric coordinate system, but having all the relevant data and metadata associated with a project in one interface improves the efficiency, accuracy, and profitability of our work, and also increases client satisfaction. It's an excellent business management tool and adds value to our deliverables. Let me relate how I got started with GIS, and why I think it can be the engine that drives a survey company.
The vision I had for my surveying business was to use mature, accepted technologies, like GIS, to keep up with jobs and to increase the velocity of every project step from the client placing the order to the transmittal of deliverables and invoice. I further envisioned the use of NGS control as a way to work with repeatable coordinates and the incorporation of GIS data and metadata into each plat and legal description produced. There were a lot of reasons I was thinking this way, including the dictum, "Follow the steps of the original surveyor." I wanted my footsteps to be easily retraced by future surveyors. And of course, in some cases, the "future surveyor" would be me or my coworkers, returning to a project or working near a past project. We have continually refined our methods as we learn more and better ways to meet these goals, and have seen extremely positive financial impact on our business. And there was an unexpected benefit: as word got out that we were actually implementing progressive technology, we attracted higher quality employees who wanted to work at a progressive firm. In turn, some of these employees became leaders and pushed us to the next levels of GIS use, and the use of other new technologies.
GIS is not a fad, and has been around since before Roger Tomlinson invented the term in the 1960s. Why, ESRI has been in business for 38 years! So GIS is here to stay, and if you've been thinking you should get into it "one of these days"'' then maybe today should be the day. There's no right or wrong time, all you really need is the interest and desire to make it happen. One of the great things about continuous learning is that we get to build on what we know and increase the speed of the "business flywheels" that are already spinning.
2007 GIS-Transportation Poster Competition: Geography Awareness Week
AUTHORSHIP: The poster must be an original and independent product of the student making the submission.
TOPIC: Transportation must be the primary subject matter. The focus of the poster may be on walking, cycling, transit (bus, rail), auto, trucking, heavy rail, pipeline, air, water, or telecommuting, on passenger travel and/or freight movement, or a combination of modes.
New Urban Research, Inc. Announces Mapping Texas Communities GIS and Analysis Workshops
“Mapping Texas Communities: Introduction to GIS & Community Analysis” will be offered on November 1st and 2nd in Austin, November 8th and 9th in Houston, November 16th in San Antonio and on November 19th in Dallas. Each workshop is one day and costs $399 per person. No previous GIS experience is necessary. Information and registration are available at http://www.urban-research.info/.
Tuesday, October 09, 2007
Google Maps Street View Adds 9 More Cities
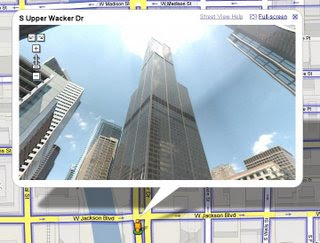
Google Maps Street View roll call has added a few more cities.
- Portland, Oregon
- Tucson, Arizona
- Philadelphia, Pennsylvania
- Pittsburgh, Pennsylvania
- Chicago, Illinois
Luckily, the images in Phoenix, Tucson and parts of Chicago are all in high resolution. Check out the Sears Tower on Google Maps to get an example of the higher quality and the added bonus of being able to pan upwards to view the entire building.
Sunday, October 07, 2007
Browser-based GIS boosts Bayswater Council's efficiency

Perth's City of Bayswater has dramatically improved its local government services, thanks to an easy-to-use browser-based spatial viewer called CitySpatial.
The City of Bayswater, located north of Perth and with a population of roughly 56,000 inhabitants, has implemented a new spatial viewer called 'CitySpatial', delivering access to multiple corporate databases for all council staff via a browser-based Web interface.
Rod Woodford has managed Bayswater's Geographic Services department for over 10 years, and says that the new system offers combined access to the council's property, customer service, infrastructure assets, and approval systems into one interface, "enabling staff to provide a more seamless level of service".
Woodford says that Bayswater staff can now access and retrieve council documents and handle customer enquiries more efficiently than ever before, greatly reducing council input/output times.
"Land Certificate request forms have gone from 14 days to a one day turnaround." [...more]
Saturday, October 06, 2007
GIS: Examining the Little Details for Limitless Potential
"Communities are changing, people are relocating," said Bob Haywood, long term community recovery ( LTCR ) specialist for the Federal Emergency Management Agency ( FEMA ). "The secondary impacts for other counties are just as critical as the lower three counties addressing direct impacts from the storm."
The LTCR program is about helping communities identify projects they deem critical to long term recovery and quality rebuilding, while re-establishing and even enhancing the quality of life for coastal Mississippi residents.
"LTCR, Geographic Information Systems ( GIS ), FEMA's Hazard Mitigation Grant Program, the Mississippi Emergency Management Agency ( MEMA ), and the Mississippi Department of Environmental Quality - we're working together to create a net, a system to help communities rebuild," said Haywood. "The Mississippi Department of Environmental Quality is required to work with the local governments. They in turn, give information to the state. The state comes to us and we bring everyone together to devise the best solutions tailored to the needs of the specific community."
GIS offers communities a method to identify trends, collect data and evaluate the potential impact of future projects. "GIS is an important tool for managing growth, a phenomenon most areas in South Mississippi are facing," said Anita Mitchell, FEMA GIS specialist. [...continue article]
China develops geographic information system
China's geographic information industry has registered 400 billion yuan (USD 53.33 billion) in aggregate output value last year and hired over 300,000 people, deputy president of the China Association for Geographic Information System, Zhong Ershun said.
He said that nearly 20,000 domestic enterprises were estimated to have engaged in the industry, with 2,000 being specialised ones.
The deputy director of the Information Product Department of the Ministry of Information Industry (MII), Chen Ying attributed the industry's rapid expansion to the country's robust economic development and the rising capital input from both government and companies. [...continue]


