Tuesday, November 21, 2006

World Flag / Geography Test

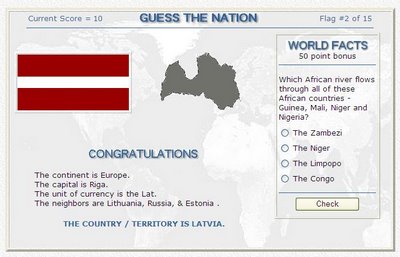
Normally, I can take the map tests and get by without looking like a fool. Then I found the Flag test which takes it one step up and gives you clues on the geography to guess the nations flag. Sounds easy enough, but hit up some of the small Asian or Former Soviet Republic nations and then see how much you know.

United States Map Quiz

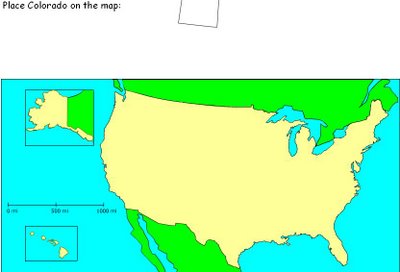
Another Map quiz. Try to place the states in their correct place.

United States Map Quiz

Virtual Earth 3D beta: A new dimension for mapping and Live Search

What if mapping the world was more like a video game?

What if you could fly like Superman and figure out where to meet your friends for a good meal and which routes to avoid to beat traffic?

With Live Search maps you can find yellow pages and white pages information, get live traffic conditions and view stunning 3D and Birds Eye …just as if you were gaming in Second Life, but with real-world information embedded in real-world cities where advertising really matters?

Check out our beta for Virtual Earth™ 3D , a new online mapping feature launched this week by Live Search. You can see terrain information for all over the world, and explore these U.S. urban areas with textured buildings (with many more to come in the next month!): San Francisco, San Jose, Seattle, Boston, Philadelphia, Los Angeles, Las Vegas, Detroit, Phoenix, Houston, Baltimore, Atlanta, Denver, Dallas and Fort Worth. There is a virtual tour that you can review before diving into the goodness.

While many folks will opt to use their keyboards, you can even use an Xbox controller to navigate the three-dimensional world for greater deftness and speed.

In addition, developers can use the Virtual Earth 3D application programming interface to build these search capabilities into their own applications and Web sites. This and other APIs for Live Search are open to developers, with the option to acquire additional support and other benefits through a service-level agreement with Microsoft. Developers can find more information about the Virtual Earth API at http://dev.live.com/virtualearth and in the Virtual Earth SDK http://dev.live.com/virtualearth/sdk/. Also, contact maplic@microsoft.com for details about additional support.

Some folks in the blogosphere noticed and we appreciate it: Liveside.net , TechCrunch, Brady Forrest , Robert Scoble, Search Engine Journal to name a few. Keep talking about it and also, let us know how to improve. As with any beta product we’d love to have feedback. You can let us know on the Virtual Earth blog at http://virtualearth.spaces.live.com/, where product updates are posted continually, or use the handy feedback link at the bottom of the application.

--The Spaceland team

Source Article

Mapping race for ocean riches underway

NOVA SCOTIA (CBC) - Canada is trying to chart new territory off the East Coast and in the Arctic to claim the resources below, but the right to stake that claim has turned into a race against the clock. The Canadian Coast Guard icebreaker Louis St. Laurent has spent four months in the Arctic laying plotting points on the outer edge of the continental shelf, an underwater mountainside that slopes as deep as 3,000 metres under the sea and ice.

"Once the edge is defined and that data is submitted to the United Nations, once that's approved, then that's Canada's territory," said Capt. Andrew MacNeil.

Dick MacDougall, with the Hydrographic Service of Canada, the agency that makes ocean maps, says the area in the East Coast is a million square kilometres, while the area in the Arctic is about 750,000 square kilometres.

"It's roughly the size of the three prairie provinces, to which Canada would have the rights to the sea bed, the resources on the sea bed and the resources below the sea bed," said MacDougall.

Finding the edge of the shelf and measuring the land that extends from it can be blocked by rocks and sediment on the bottom. To get that proportion right, mappers must look at where the sediment starts to thin out.

...continue article

Monday, November 20, 2006

ANGRY BEAVER SHIRTS

Dam It All! Catch the Angry Beaver as he looks out on the world and wants to conquer it the only way he knows how - by building dams! Dark Tees, Light Tees, Thongs (Yeah! I went there!), Bags, cards, stickers, and gifts. Nice!

Sunday, November 19, 2006

BLUE PLANET - PHOTO ESSAY

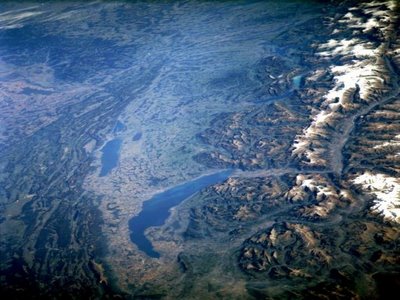
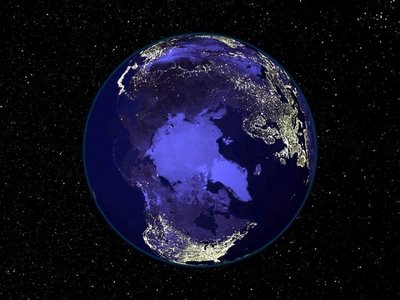
What a Beautiful Blue Planet is a series of satellite pictures of the Earth with the goal to help people realize what a nice home we all have.

What a Beautiful Blue Planet

Directions Magazine

The Worldwide Source for Geospatial Technology

Directions Magazine was first published in 1998 and remains the premier news and resource guide for geospatial professionals.

Directions Magazine publishes weekly newsletters about geographic information systems, global positioning systems, desktop mapping, cartography, computer-aided design, remote sensing, web services, and more.

Directions Magazine

Saturday, November 18, 2006

NFL BLACKOUT MAPS

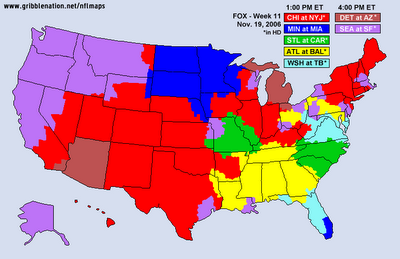
Have you ever wondered what the heck the programmers were thinking when they set up the games in your local market. In East Tennessee, they have a simple formula: pick the lamest game. This market is exempt from the rest of the country, however, as indicated in the NFL Blackout Maps which show the local programming for each area of the country.

NFL BLACKOUT MAPS

CountryReports.org — Country Information

CountryReports.org — Country Information

CountryReports.org was established in 1997 out of a love for international relations and culture. Entirely web-based, we offer more than 26,000 pages of content covering a wide-range of topics. Our statistical data and cultural information has proven to be valuable to students, parents, teachers, and researchers alike. In a sea of competing websites, CountryReports.org stands out as a leader, ...:

CountryReports.org — Country Information

CITY-DATA.COM

CITY-DATA.COM

We've collected and analyzed data from numerous sources to create as complete and interesting profiles of all U.S. cities as we could. We have over 30,000 city photos not found anywhere else, hundreds of thousands of maps, satellite photos, stats about residents (race, income, ancestries, education, employment...), geographical data, state profiles, crime data, housing, businesses, birthplaces of famous people, political contributions, city government employment, weather, hospitals, schools, libraries, houses, airports, radio and TV stations, zip codes, area codes, user-submitted facts, similar cities list, comparisons to averages... If you ever need to research any city for any reason, from considering a move there to just checking where somebody you know is staying, this is the site for you.

CITY-DATA.COM

Multimap.com – Online Maps to Everywhere

www.multimap.com is Europe’s most popular mapping web site, offering a range of free, useful services to assist with everyday life. Key features include street-level maps of the United Kingdom, Europe, Australia, New Zealand, Canada, the US and a number of cities worldwide; road maps of the world; door-to-door travel directions; aerial photographs with map overlay; and local information. Multimap also provides a range of complementary services through its partners. These include hotel, holiday-cottage, and restaurant-booking services, and the ability to buy both historic and aerial photograph prints.

Since its launch in 1996, Multimap has become one of the 10 most-visited sites in the UK. The consumer web site regularly receives more than 12 million unique users and delivers more than 190 million page views per month. Traffic continues to grow on average by 30% annually.

Multimap.com – Online Maps to Everywhere

Friday, November 17, 2006

GPS Surveillance Creeps into Daily Life

For $5.99 per month, you can turn a cell phone into a surveillance device and track when your target leaves home, where he or she travels and at what speed. You can even detect how much battery power is left on the phone. Marketed as "virtual eyes" on your kids or employees, the service also allows you to construct a virtual "fence" so that you can receive electronic alerts if the phone’s carrier crosses into forbidden areas.

...Florida GIS Data Blog

World's Highest Resolution Commercial Satellite

GeoEye-1, World's Highest Resolution Commercial Satellite, Will Use SGI Technology to Process Image Data

Billion of Bytes Sized Data Sets for National Security and Commercial Applications Demand 64-Bit, High-Performance Compute Only SGI Altix Systems Can Deliver

ORLANDO, Fla., GEOINT 2006, Booth 207, (November 15, 2006) — In anticipation of the spring 2007 launch of an extremely high-resolution Earth imagery satellite, GeoEye (Nasdaq:GEOY), the world's largest commercial satellite remote-sensing company, purchased high-bandwidth, high-performance compute technology from SGI (Nasdaq: SGIC). At the Dulles, VA, ground station for the new GeoEye-1 satellite, four SGI® Altix® systems were delivered during the first calendar quarter that will drive core satellite image processing for the .41-meter panchromatic (sensitive to all visible colors) and 1.65-meter multi-spectral (sensing and recording radiation from invisible as well as visible parts of the electromagnetic spectrum) imagery. GeoEye-1 is anticipated to collect more than 700,000 square kilometers - billions of bytes - of high-resolution imagery every day. A long-time SGI customer supplying imagery to the U.S. government, international governments and a growing number of commercial clients, GeoEye selected SGI systems because the record amounts of image data from the new satellite will require 4X the processing power.

"We have three satellites currently in orbit - OrbView-2 and 3, and IKONOS - but when GeoEye-1 becomes fully operational, it will be the world's most powerful and most accurate high-resolution commercial imaging satellite. It's going to collect more imagery on a given day than any commercial system currently on orbit," said Don Koboldt, senior principal geodetic engineer, GeoEye. "I chose SGI Altix because it has 64-bit processing power, not 32, and because there's a lot of computing power required for everything we do, including modeling the sensor and re-sampling all this data onto a geographic system. Not to mention the actual volumes of pixel data that has to be processed. It's both an I/O-bound problem and a compute problem, and SGI is taking the lead in designing systems for this need."

The GeoEye-1 satellite's ability to go down to a .41-meter resolution means, in simple terms, the high-resolution imagery taken from orbit and processed by the SGI® Altix® 350 systems will be capable of discerning objects on the ground 16 inches in size or larger. At that resolution, one would be able to identify home plate on a baseball diamond or count the manholes on a city street. In general, GeoEye's products are utilized in a wide variety of applications including defense and intelligence for large area mapping, state and local governments for urban planning and mapping, insurance and risk management, environmental monitoring and disaster relief. Such imagery is also ideal for on-line mapping search engines.

...More at GeoEye Press Release

Drought Monitor Interactive Maps

The Drought Impact Reporter is an interactive tool developed by the NDMC to collect, quantify, and map reported drought impacts for the United States. The tool was created in response to the need for a national drought impact database. Information for the impact report database comes from a variety of sources, including on-line drought-related news stories and scientific publications, reviewed by NDMC staff; members of the public who visit the website and submit a drought-related impact; members of the media; and members of government agencies such as NOAA and USDA.

Thursday, November 16, 2006

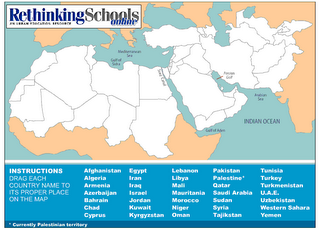
MAP TEST-How good are You?

It's a little harder than it looks because they throw in a bunch of "...stans" that I had trouble with.

Tsunamis slap Hawaii, Calif. north coast

By AUDREY McAVOY, Associated Press Writer

HONOLULU - Tsunamis generated by a major earthquake near Japan left behind little damage but offered a legitimate test of international warning systems.

The waves, some measuring a few feet high, struck Hawaii shores Wednesday, slightly injuring one swimmer and temporarily flooding a harbor. A surge along California's northern coast destroyed two docks in Crescent City Harbor and damaged a third.

The waves hit Hawaii about six hours after a magnitude 8.1 earthquake struck north of Japan. Tsunami warnings were issued by the Pacific Tsunami Warning Center, which reported that its system of sending alerts functioned properly.

"It went very smoothly, and there weren't any major problems at all," said Brian Shiro, a geophysicist at the center. "We issued a warning for 1,000 kilometers surrounding the earthquake and an advisory for the rest of the Pacific Ocean."

The alerts were canceled once the center received further information that showed the tsunami was going to be small, he said. The center canceled the tsunami watch for Hawaii when it became clear the waves were unlikely to top one meter, or about 3.3 feet.

But local civil defense authorities still warned people to stay out of the water and to exercise caution near harbors, given the possibility the earthquake would generate unusual currents around Hawaii.

A woman swimming at Waikiki suffered cuts when she was sucked through an opening in a seawall as the water receded just before the swells arrived. She was otherwise fine, said John Cummings, a spokesman for Oahu Civil Defense.

On Kauai, a 2 1/2-foot swell flooded a parking lot at Nawiliwili Harbor. No serious damage was reported.

"Some of the boats hit the bottom with their keels when the water receded, sort of jostled them around their moorings when the wave came through," said Mark Marshall, Kauai County civil defense administrator.

In California, the weather service issued an early-morning tsunami advisory but dropped it by the time waves traveling up to 30 mph moved in at Crescent City, about 20 miles south of the Oregon state line.

Harbor workers there noticed a fast-moving current around mid-afternoon that harbor master Richard Young described as a "river within the ocean."

As the surge rushed out of the harbor, two floating docks in the inner basin were destroyed, Young said. Another surge followed, severely damaging a third dock, he said.

Several vessels attached to the destroyed docks bobbed away from their anchorage and likely received dings and possibly greater damages, the harbor master said.

Young said the replacement costs of the docks could range from $300,000 to $700,000.

Some 400 miles to the south, waves pounded the Santa Cruz yacht harbor all afternoon, causing several boats to break away from their moorings and capsizing a small sailboat.

"It wasn't wave action," said Dave Reynolds, a Monterey-based weather service meteorologist. "It was the current that caused the damage. This is almost like a fast-moving river of water that is coming in, so ... it's the currents that toss the boats around."

Thousands of people living along northern Japan's Pacific coast fled to higher ground, but Japan's meteorological agency withdrew its tsunami warning after about three hours. The waves near Japan did not swell higher than 23 inches.

___ On the Net:

Pacific Tsunami Warning Center

Source Article
ATTENTION-NEW FORMAT-PLEASE READ

Welcome to the new format for GIS SITES the blog companion to my GIS & Mapping link site, GIS PILOT. As of today, there is a new format for this site which STILL INCLUDES all GIS LINKS from the old format. All the GIS LINKS are now on the sidebar to the right. Because the links are similar to GIS PILOT, my main site, and it is a hassle to update links on 2 sites, only GIS PILOT will have updated links from now on. This blog will always have GIS LINKS on it, just now it will be smaller and load faster.

All links for GIS SITES for the states and countries will point toward their respective GIS PILOT links. This allows for an easier management for the blog and GIS PILOT. Blogger has problems with the size of the HTML for this BLOG, resulting in just painfully slow load times and publishing with many errors. Both sites will remain active and doing their same jobs. I'm only condensing this blog for easier management.
Thanks

World Sunlight Map

Watch the sun rise and set all over the world on this real-time, computer-generated illustration of the earth's patterns of sunlight, darkness, and cloud cover based on current weather satellite data.